UI Basics
The Mambu Process Orchestrator (MPO) UI allows you to manage users, create processes and state diagrams, and run tasks. In most cases, once processes are created in the UI, they are triggered using the MPO API. Processes are where you create logic to execute business processes. State diagrams support processes by storing state information and operational data that can be retrieved and used in any processes.
Using the MPO UI requires a username and password, which you receive when you sign up for MPO or when one of the administrators of your instance creates an account for you. If your instance is in a shared environment, the URL may look like this: https://ireland2.mpo.mambu.com/. If you have a dedicated environment, the URL may look like this: https://TENANT_NAME.mpo.mambu.com/.
Workspace tab
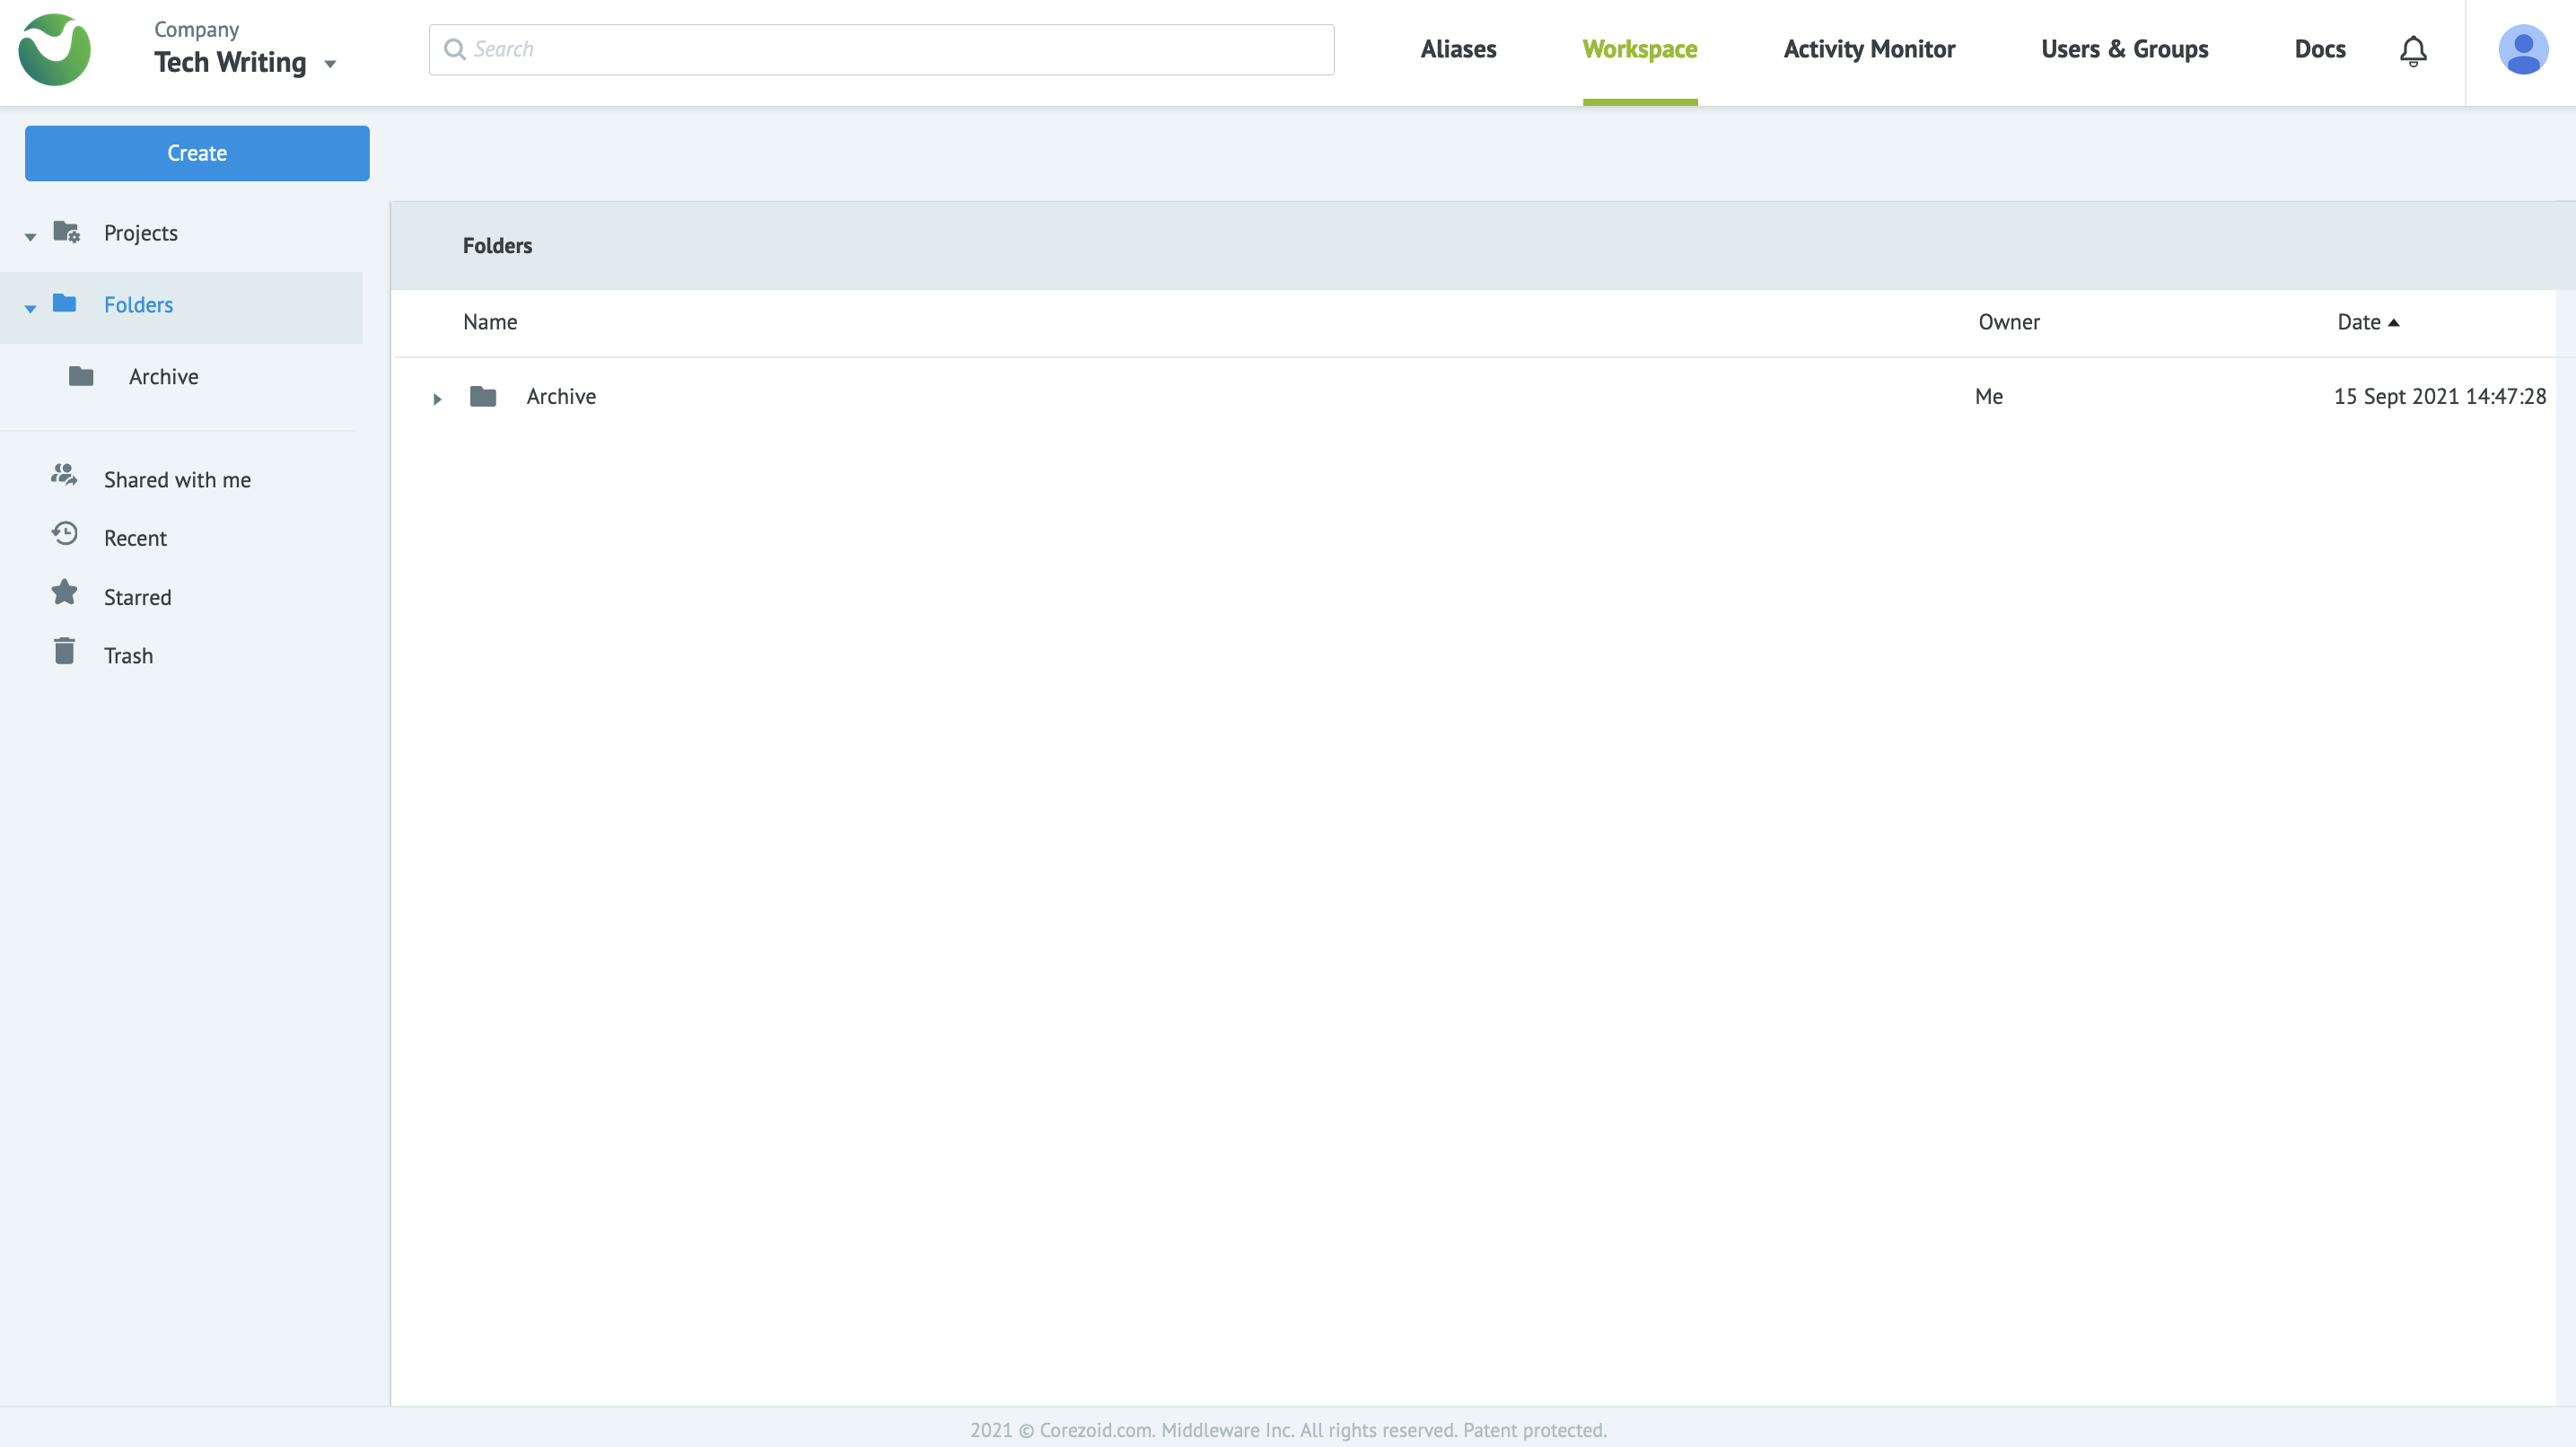
On the Workspace tab of MPO you can find all the processes, state diagrams, and dashboards that you have created or have been shared with you. These can be arranged into folders. On the left-hand side, we have the Create button for creating processes, state diagrams, dashboards, folders, and for importing processes. Below that are the folders you have access to. The top bar holds options for the different sections of MPO:
- Aliases: Shortcuts for processes and state diagrams. For more information, see Using Aliases.
- Workspace: The default home page of MPO where all processes, state diagrams, and dashboards are displayed.
- Activity Monitor: Basic analytics on the number of tasks run, state changes, and overall traffic.
- Users & Groups: Where you can manage users and groups. For more information, see Creating and Managing Users.
- Docs: A link to the support documentation for MPO.
Importing and exporting MPO objects
MPO objects are imported and exported as JSON objects. Both operations are done from the Workspace tab.
Importing into MPO
- In the Workspace tab, open the folder you would like to import your object into.
- Select the Create button.
- Select the From file… option in the dropdown menu.
- Select the JSON file you want to import or select a ZIP file to also import aliases.
Exporting from MPO
- In the Workspace tab, find the object you want to export.
- Right-click on the object and select Download.
- You can choose to download the object as a JSON file or zipped as a ZIP file. You may also include any linked aliases if you choose to download the ZIP file.
- When the download is ready, you will receive an email with a download link.
Creating processes and state diagrams in edit mode
To work on a process or state diagram you need to work in edit mode. Start by selecting Create in the upper left-hand corner of the Workspace tab and selecting either Process or State diagram.
When the Create process screen displays, enter a name for your new process. Select OK and the new process will open in a new tab in edit mode.
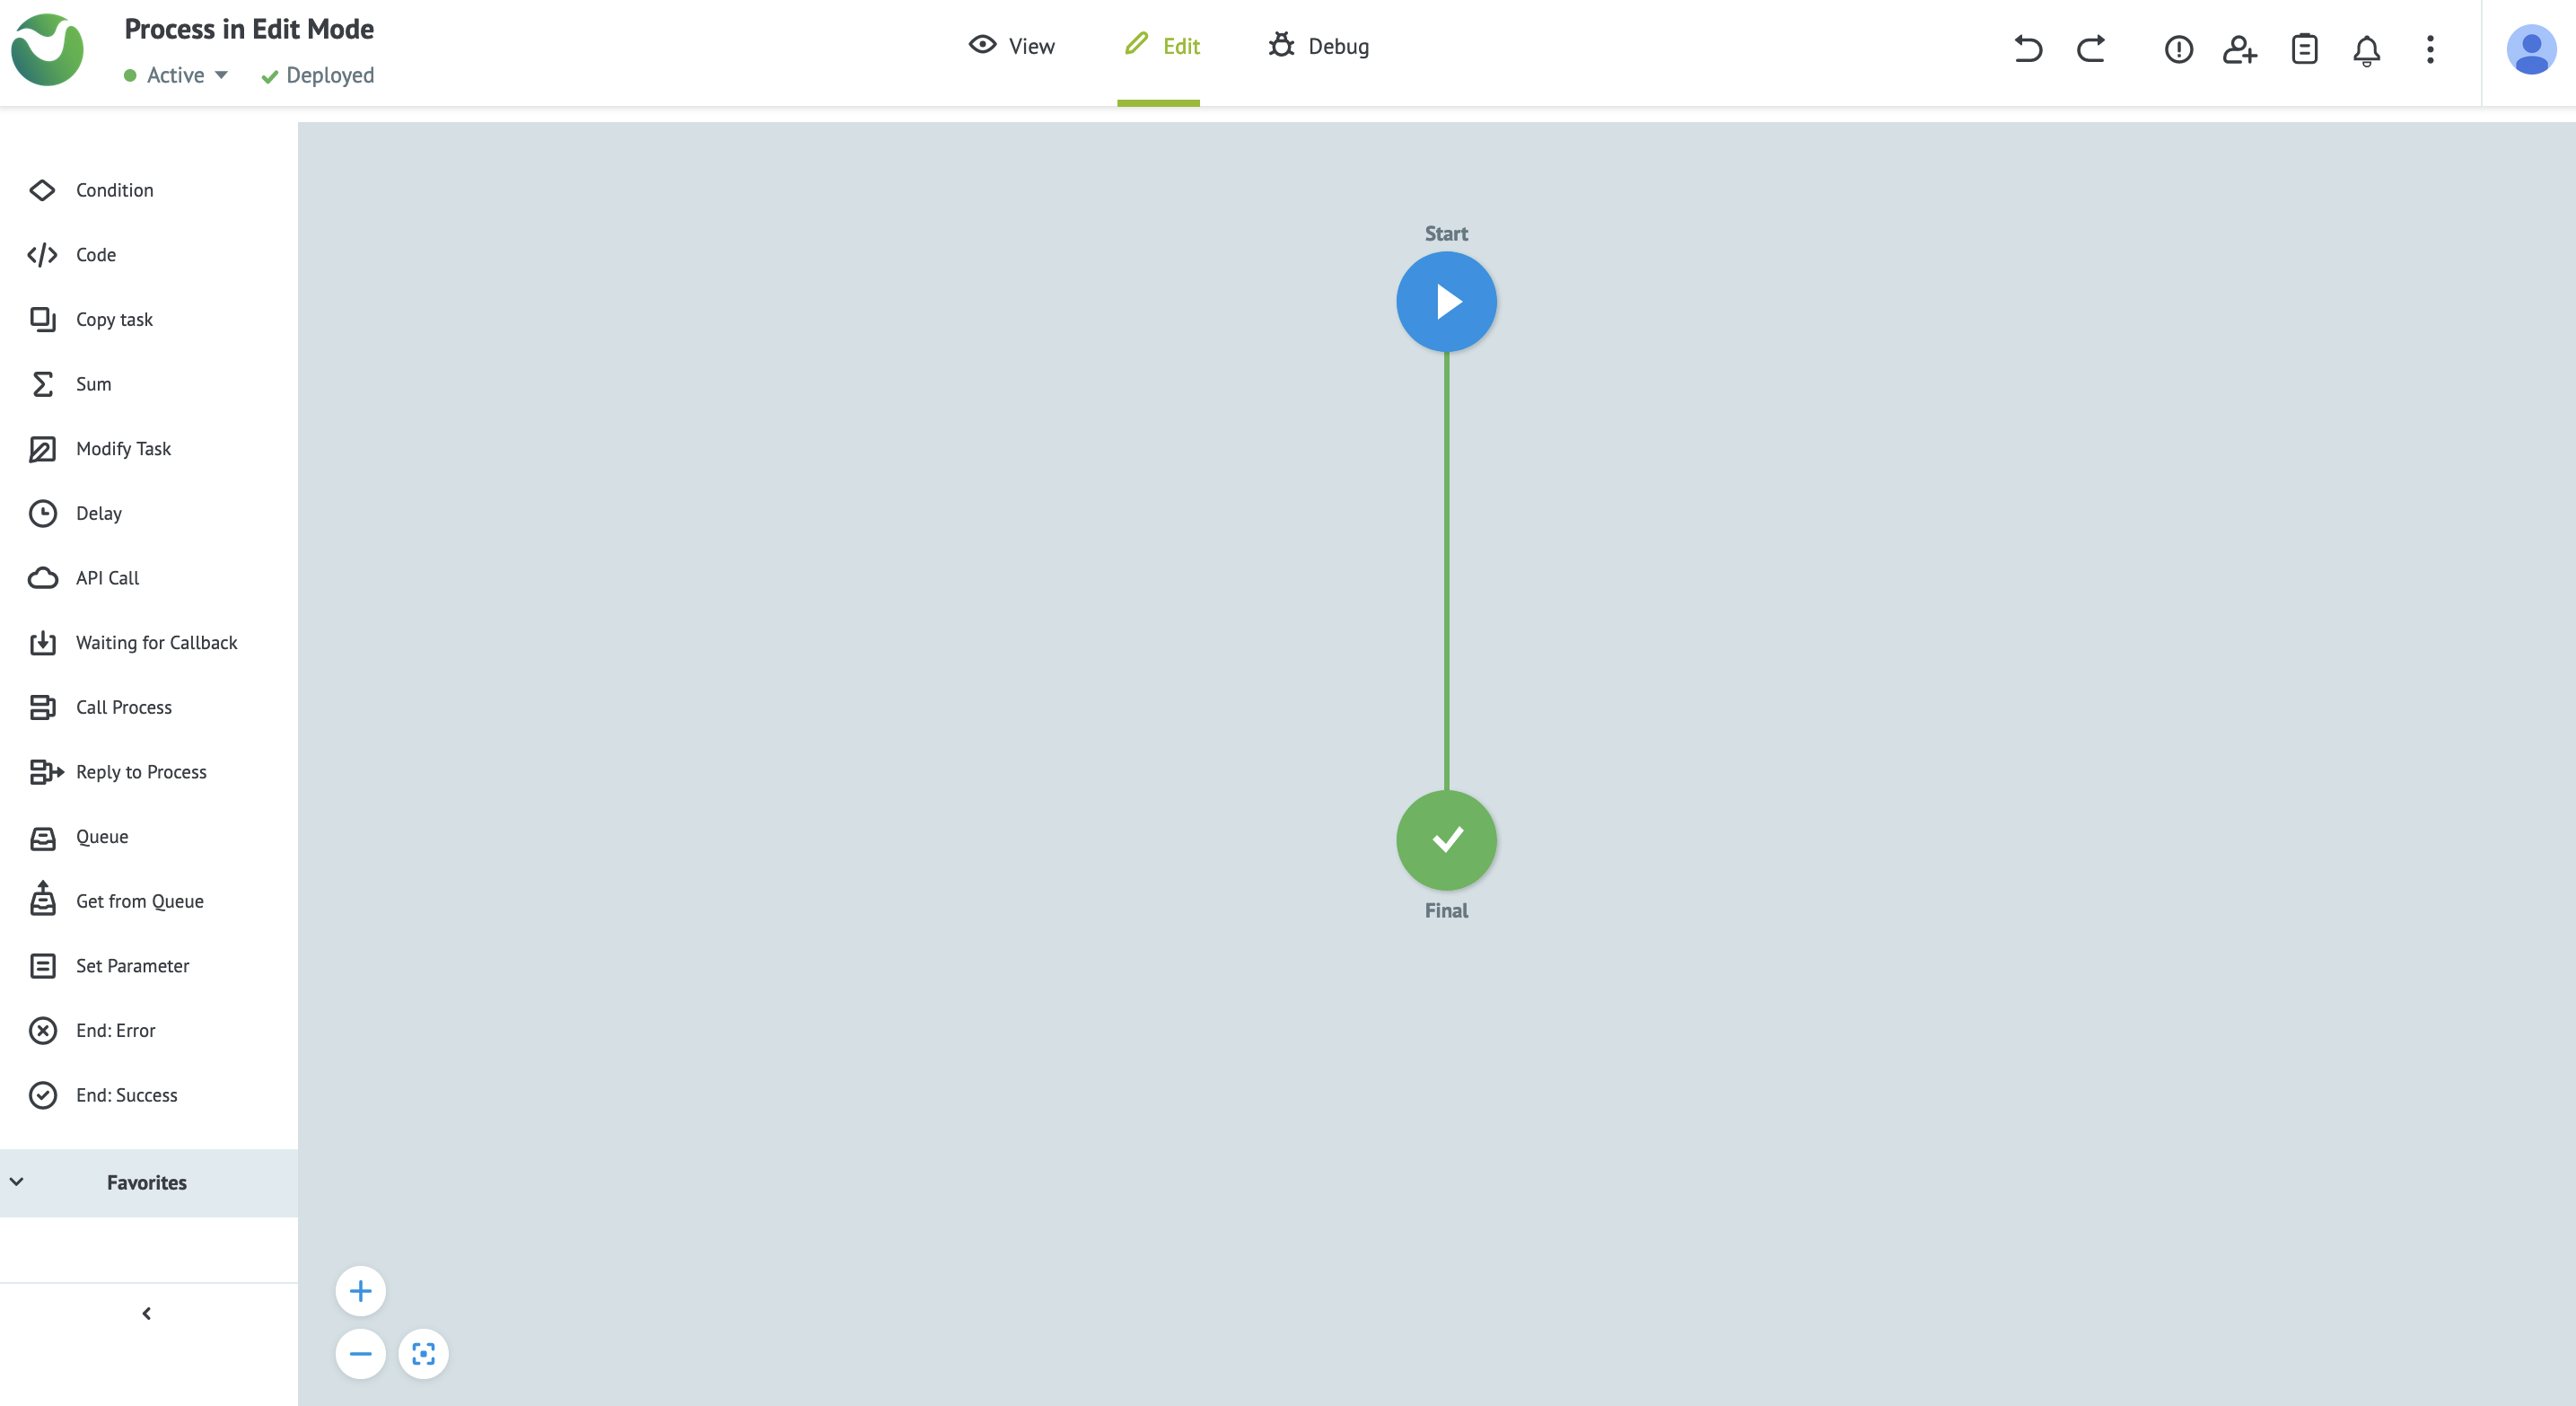
The Edit mode window contains a large central pane, which is the canvas, as well as a menu bar across the top and node logic pane on the left-hand side. The Start node is created automatically.
It is recommended that every process begins with a Start node and every outcome should conclude with a Final node to avoid creating infinite loops. If the process were to run in its current state, the task would pass from the start to the end node without any changes or redirection and without triggering any additional actions. To build out the process, we need to add nodes.
Menu bar
The menu bar contains three groups of buttons:
- On the top left-hand side of the screen under the title, in a dropdown menu, you can control the state of the process: you can set it to Active, Paused, or Debug. An additional state of Blocked can be set once you have deployed your work.
- The button next to the dropdown allows you to deploy and save your work.
- In the center of the screen, you can switch between the three modes: View mode, Edit mode, and Debug mode.
You may also rename process or state diagram by selecting the title.
On the top right-hand side, from left to right, you can:
- Undo and redo the 20 most recent actions.
- View error descriptions of errors within your process.
- Share your process.
- Edit task parameters, where you can add variables that will be used in the process as key-value pairs -
{{key}}:value. - View notifications.
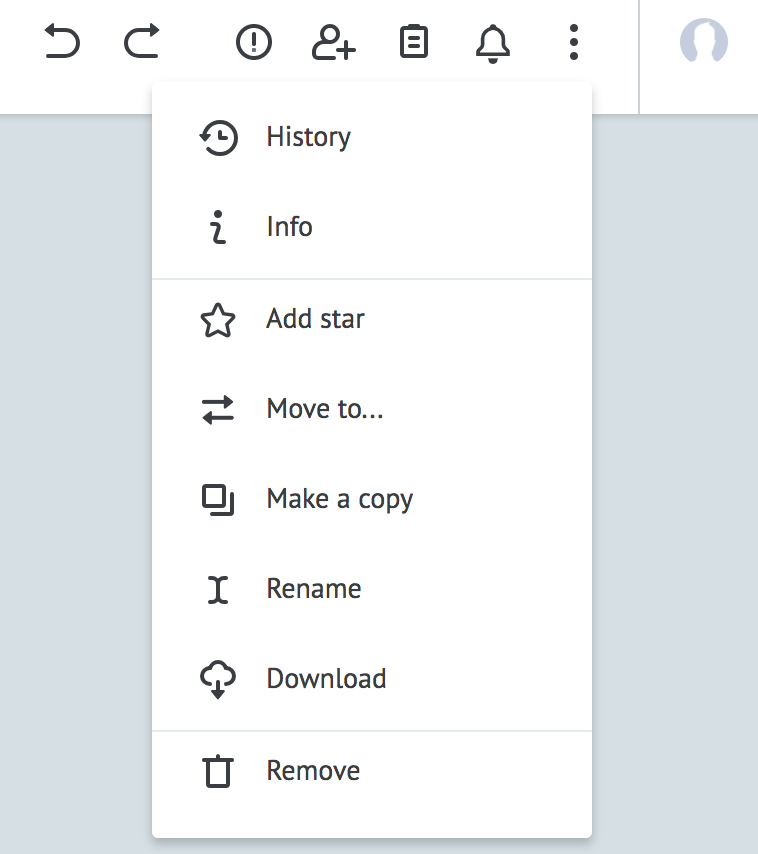
The following additional options are available via the three-dots menu: History, Info, Add star, Move to…, Make a copy, Rename, Download, and Delete.
Finally, you can select the user icon in the top right-hand corner to view more information about your MPO account and to log out.
The actions in the three-dots menu apply to the whole process and not individual nodes. For example, the Rename option will rename the whole process.
Node logic pane
The nodes pane allows you to add actions to your process. Nodes are units of logic that help you build your process. For descriptions of each node type, see Node Basics.
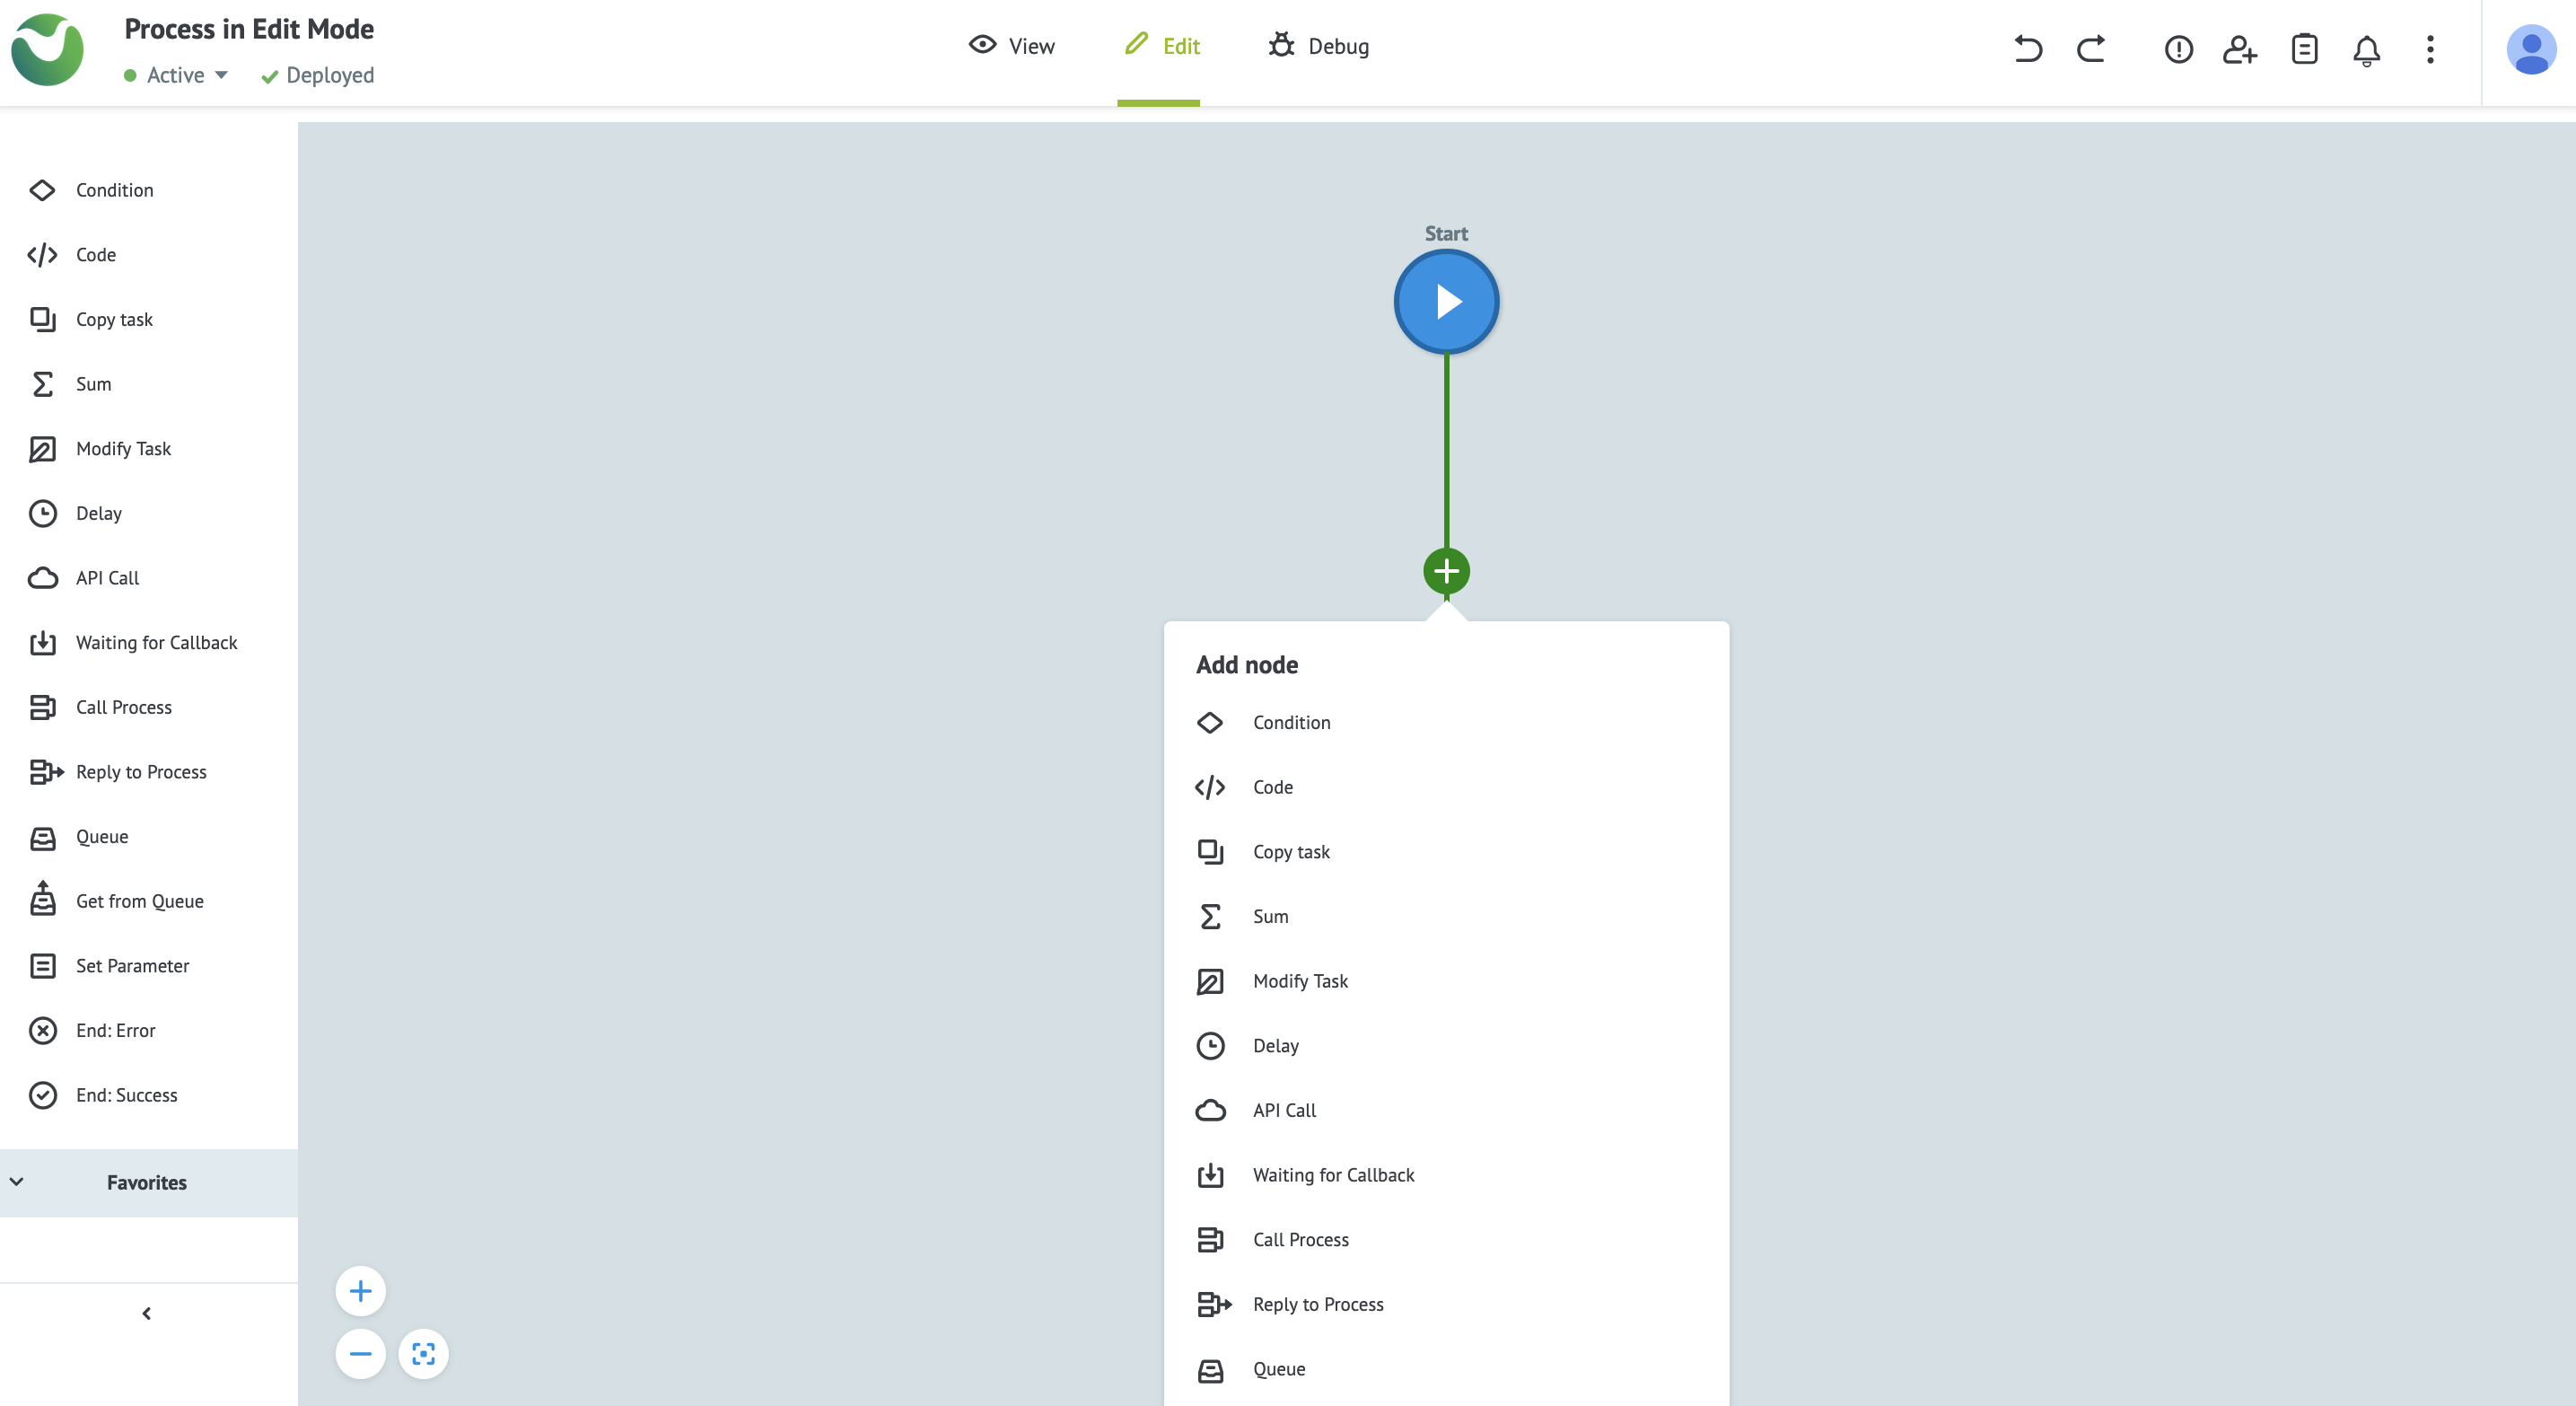
There are two ways to add a node to a process:
- Drag and drop the node from the node logic pane to a blank space on the canvas or over a green line to add it between other nodes.
- Selecting the plus icon (
+) on the connector between two nodes or at the bottom of an unconnected node.
Node configuration box
When you add a node to a process a configuration box will display on the right-hand side. This box usually allows you to add parameters (or variables), amongst other options.
Different nodes have different configuration options, but the options consistently available for all nodes are:
- Adding a title.
- Adding a description.
- Copying the node.
- Removing the node.
- Removing connections to and from the node.
- Showing the node’s ID.
- Display errors thrown by the node.
We recommend always adding titles and descriptions to your nodes to make your processes and state diagrams easier to understand when they become complex.
Leading, trailing, and middle white spaces are automatically removed in parameter key-value pairs and in the code editor for Raw, JSON, and XML modes. For example: the parameter value
_ odb.odometers measure _ is trimmed to _odb.odometersmeasure_ when moving focus from the field.Running tasks in view mode
Before running a task you need to save and deploy your work by selecting Deploy in edit mode. In order to run a task, select View mode in the menu bar.
Please Note:
A process or state diagram that has been initiated is called a task. A single process or state diagram may have many active tasks at the same time.
To send a new task selecting + New task in the options below the main menu bar. The New Task pane will display on the left. In the pane you can new add parameters to be used in the task as key-value pairs. Then select Add task to run it.
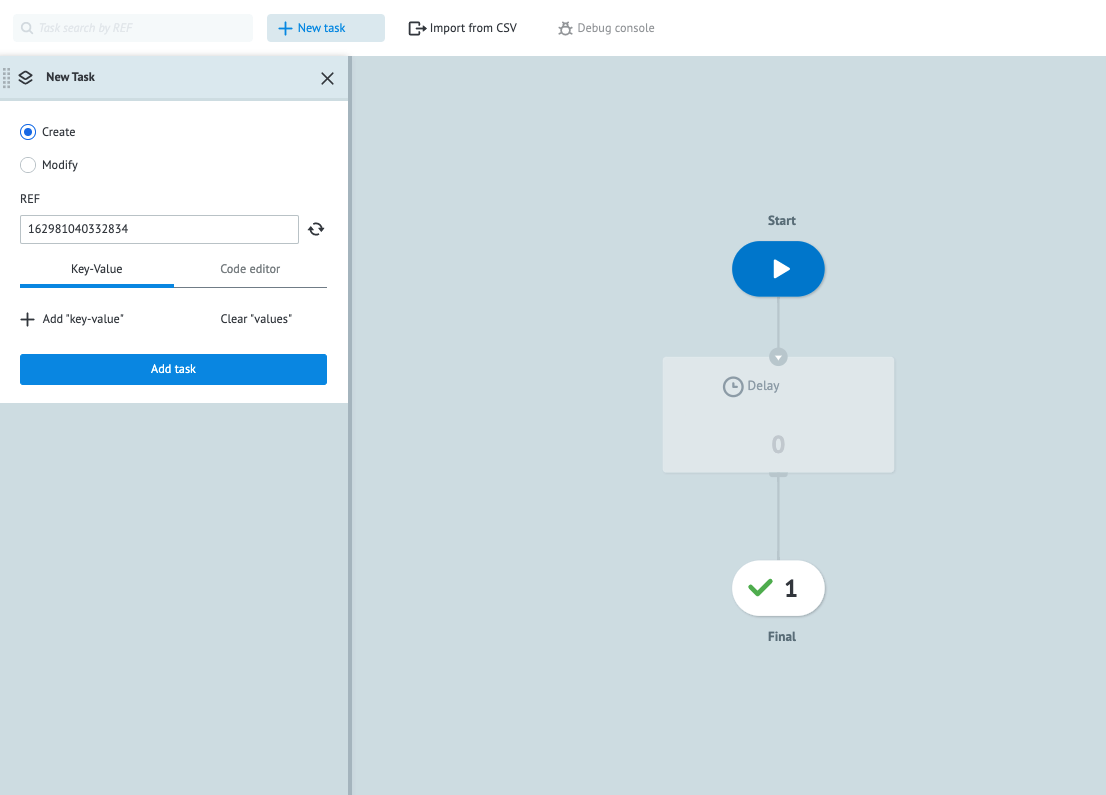
In the Final nodes you will see counters for the number of tasks that have reached each endpoint. Additional information is available when you select any node and the information panel on the right-hand side pops up with Statistics about all the tasks that have been run through the node and an Archive of responses and errors that the task has returned.
Please Note:
Final nodes come in two types - End: Success and End: Error nodes. Both types store information about tasks that have ended at their endpoints.
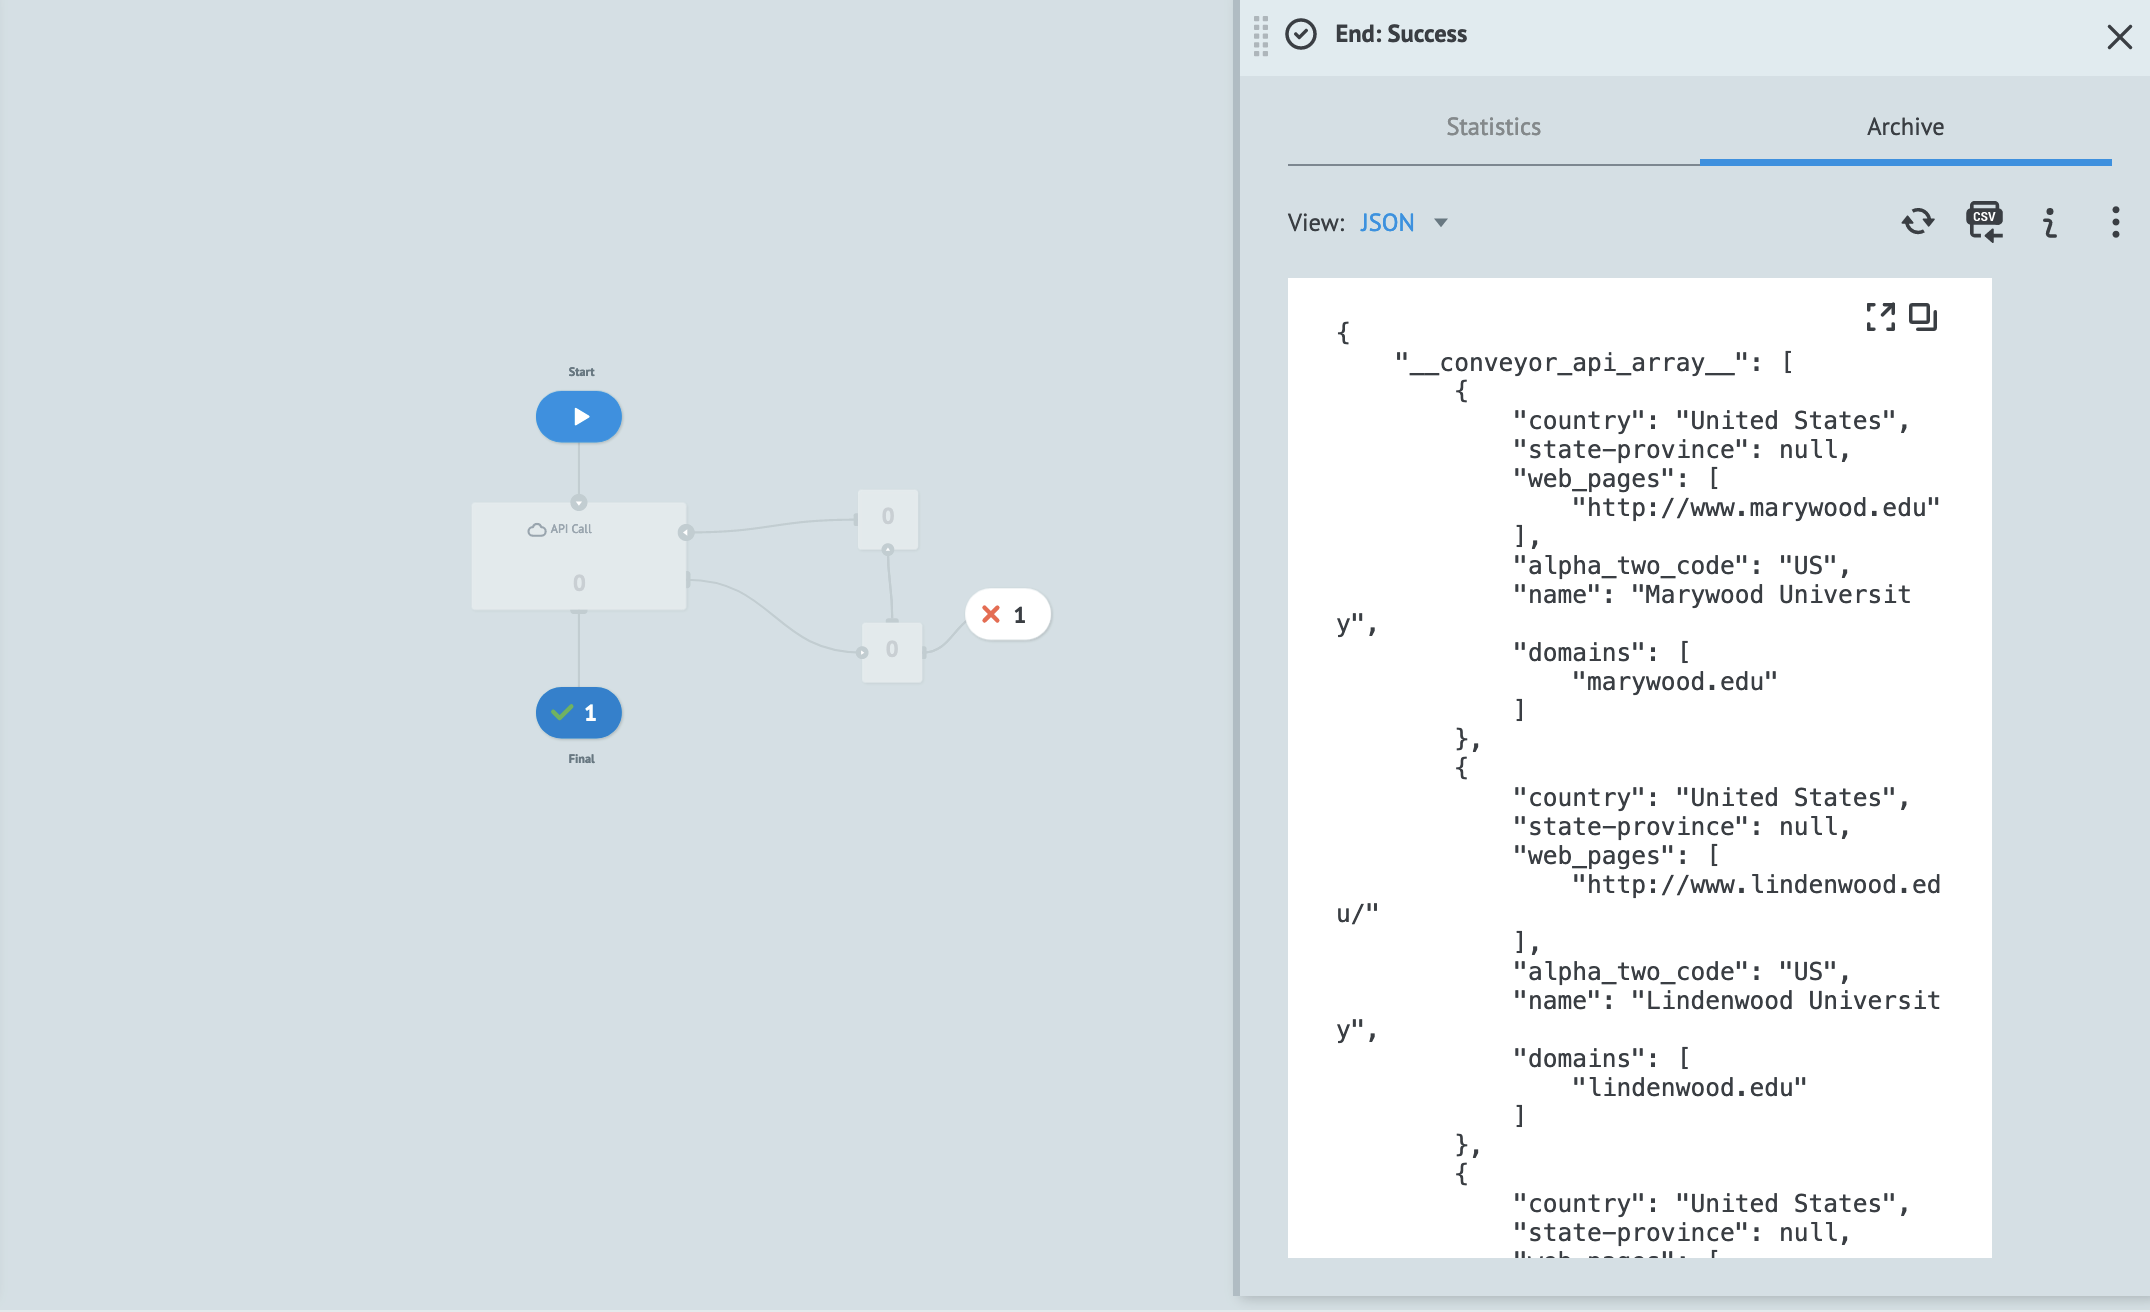
Under the Archive tab you can view and export responses and errors in JSON or as a table, which you can also export as a CSV. To reset the task counter for a node, select the three-dot menu and select Reset Counter.
Debug mode
Before debugging, it is recommended that you set the state of the process or state diagram to Debug in the status menu dropdown (in the top right-hand side menu) in Edit mode. To start debugging go to Debug mode in the menu bar.
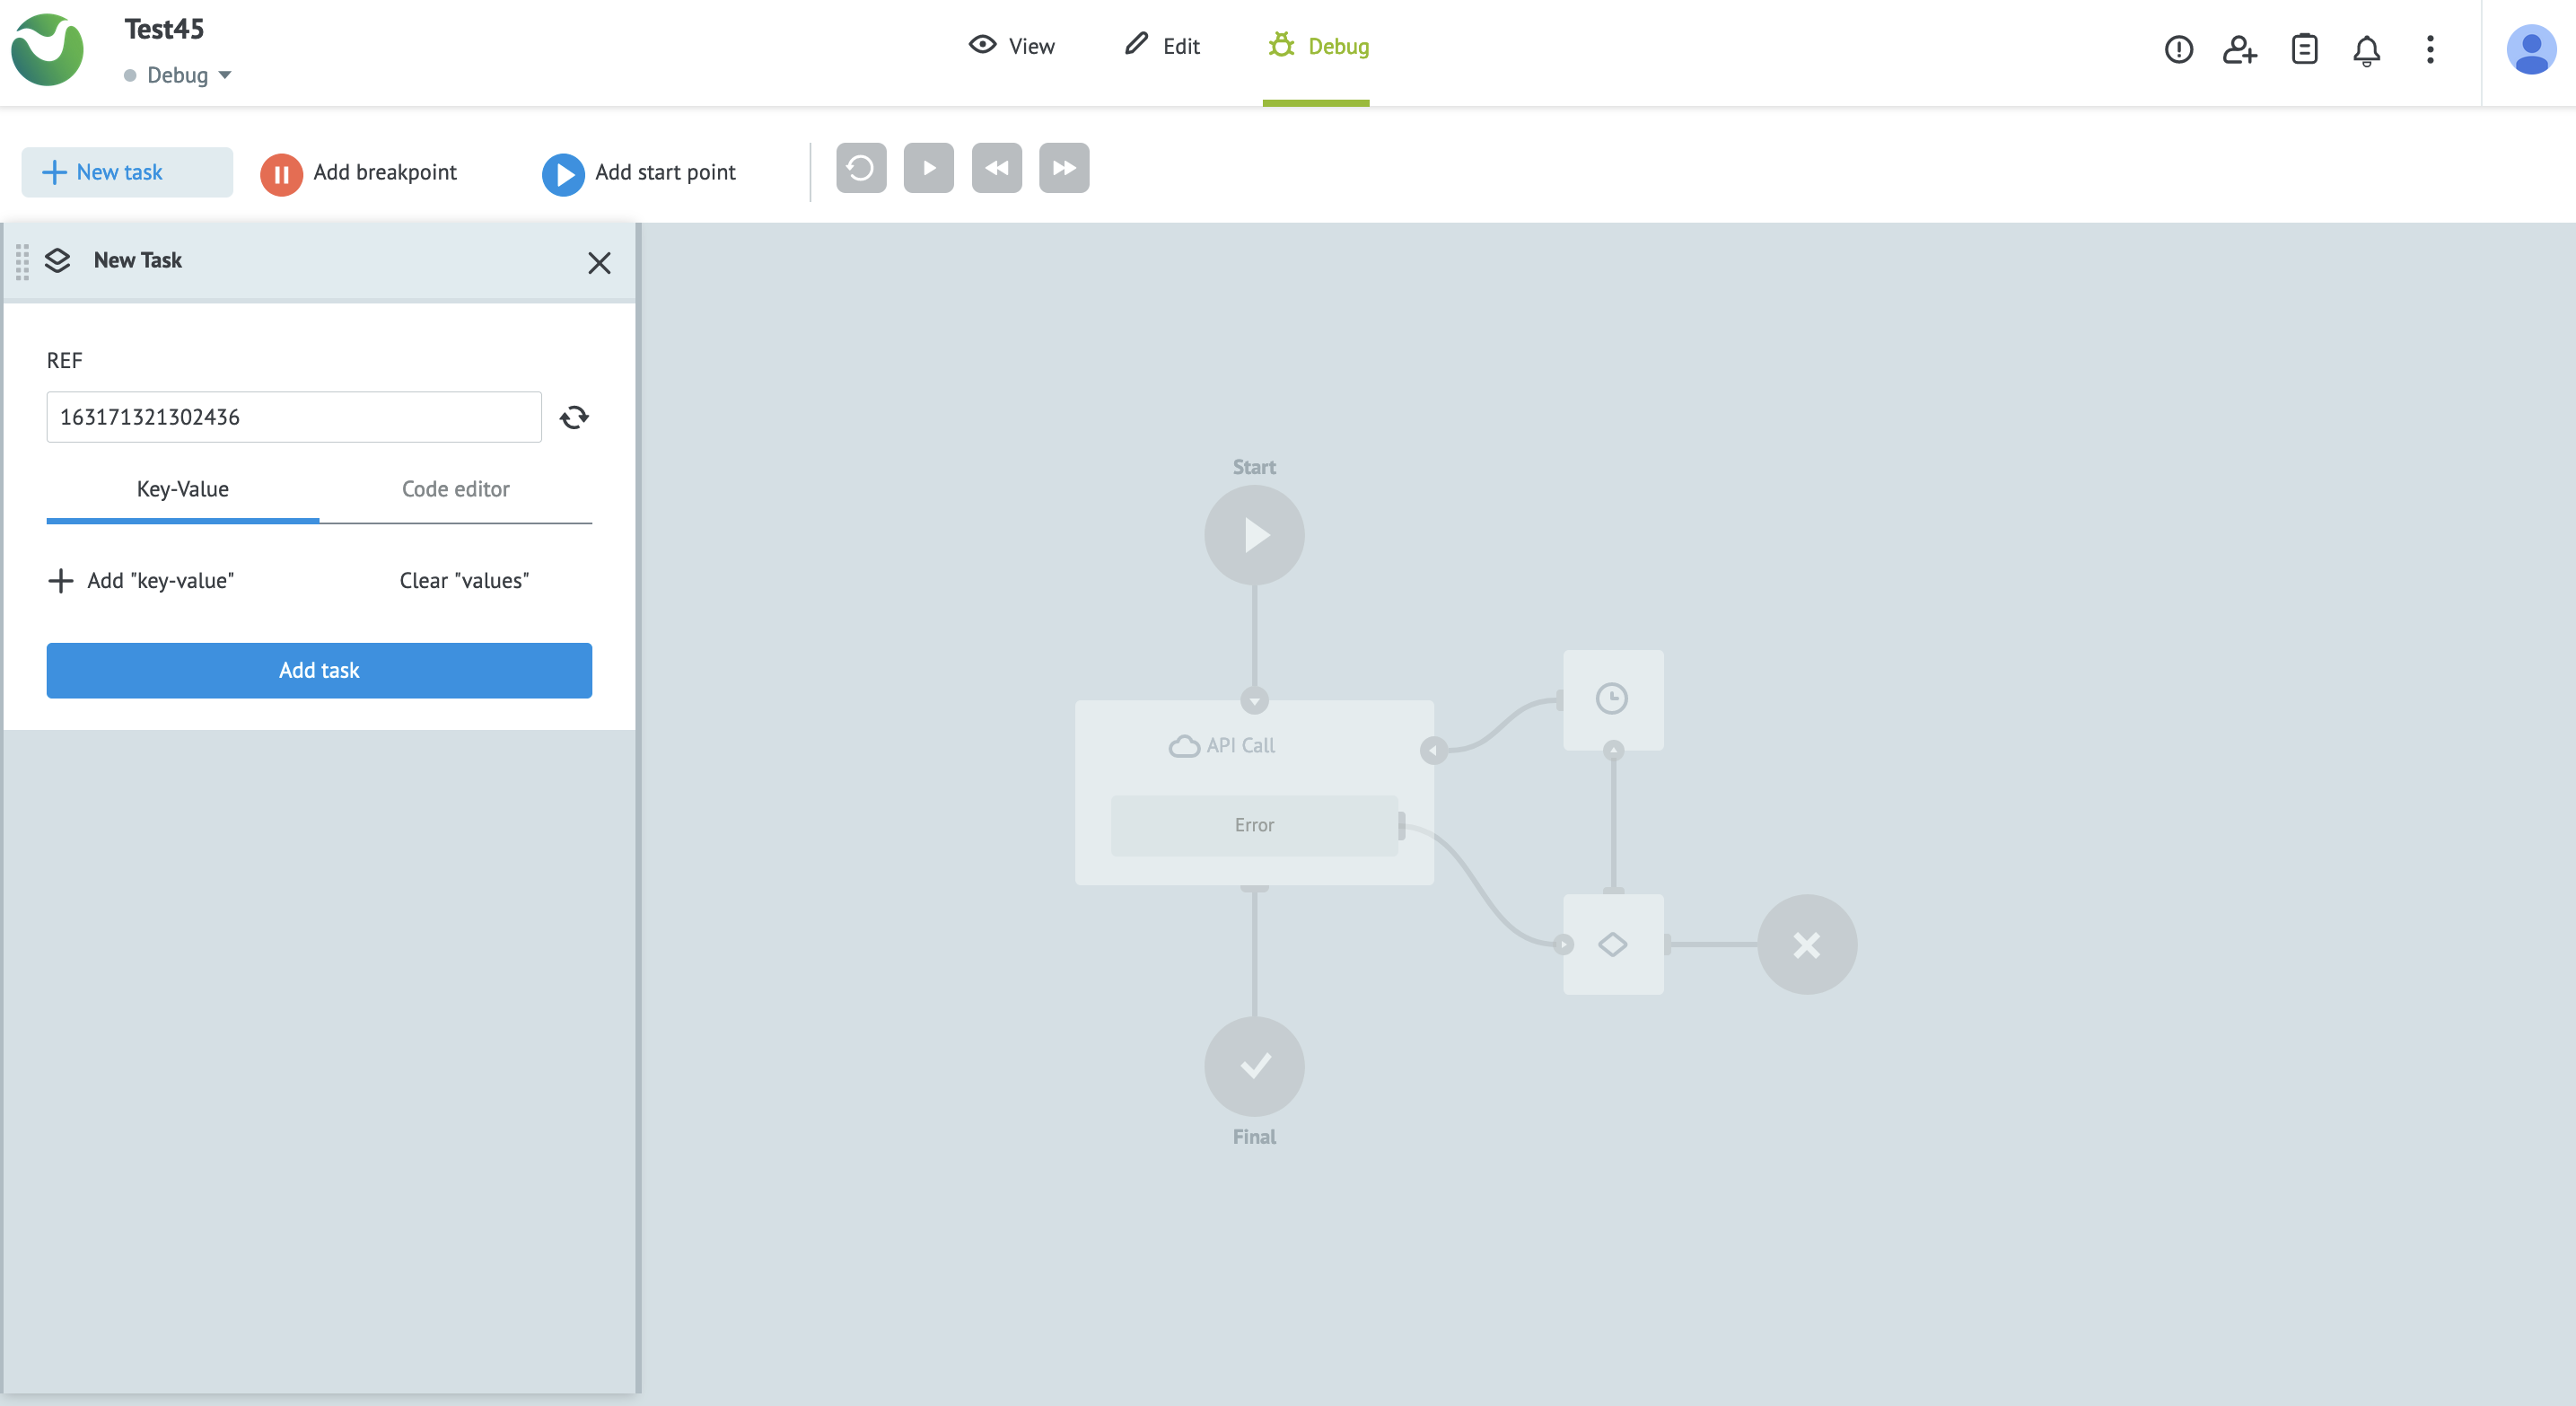
On the top left-hand side you will find the New Task panel, to start a new task, and in the sub-menu you’ll find options to:
- Add breakpoint: Change the end point of the process to isolate a section. To add a breakpoint drag Add breakpoint to where you want to pause the task.
- Add start point: Change the start point of the process to isolate a section. To add a start point drag Add start point to where you want to pause the task.
- Repeat: Repeat running the task.
- Start / Stop: Start or stop the task. This runs the task normally and not step-by-step as with Step back and Step forward.
- Step back: Move the task backward by one node to execute it manually node-by-node.
- Step forward: Move the task forward by one node to execute it manually node-by-node.
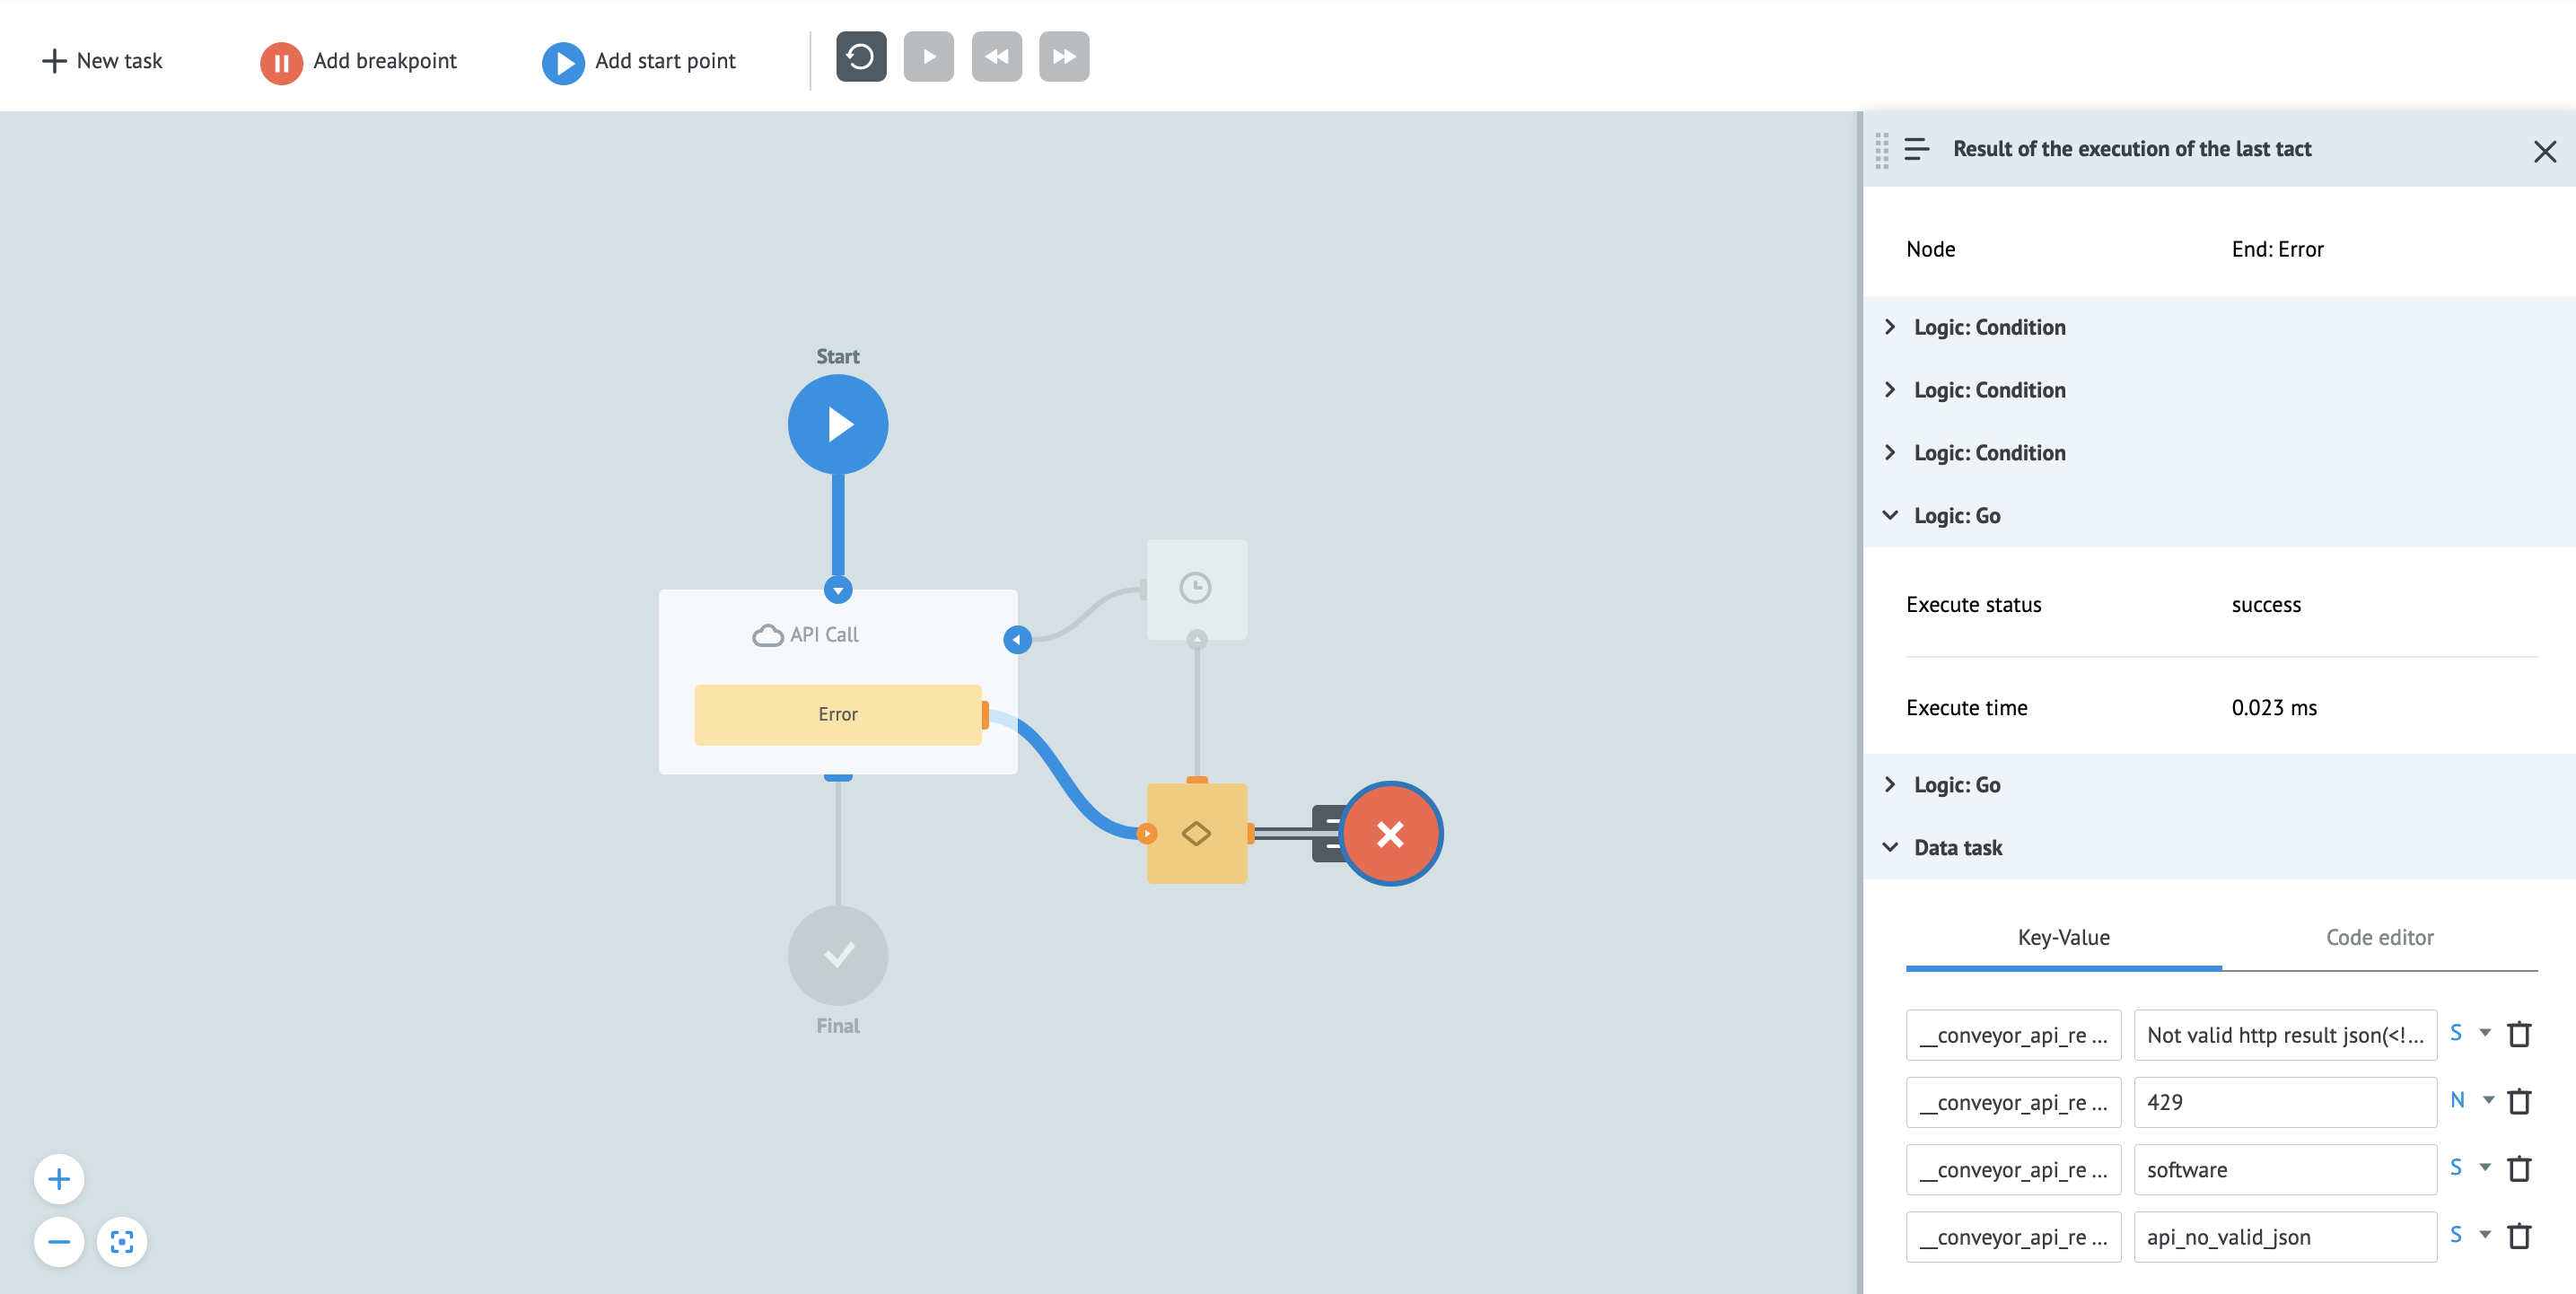
When you add a new task you’ll see an information box on the right-hand side, which contains parameter values at each step of the running task under Data task. If you use the Step back and Step forwards controls, you can also change parameter values under the Key-Value tab to fix or improve your task. To edit or view code you can select the Code editor tab.